Thinking like a designer
Materials for class on Wednesday, November 8, 2017
Contents
Slides
Download the slides from today’s lecture.
Fonts, colors, and accessibility
See the relevant sections in the Reference page.
Long-Term Workhouse Inmates in England and Wales, 1861
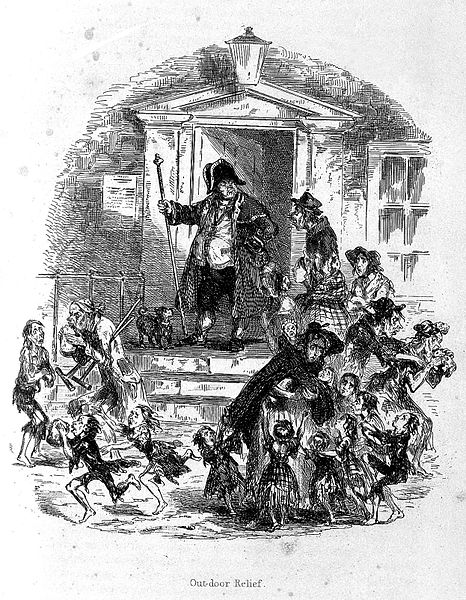 Poor people coming to a workhouse for food
“Are there no prisons?” asked Scrooge.
“Plenty of prisons,” said the gentleman, laying down the pen again.
“And the Union workhouses?” demanded Scrooge. “Are they still in operation?”
“They are. Still,” returned the gentleman, “I wish I could say they were not.”
“The Treadmill and the Poor Law are in full vigour, then?” said Scrooge.
“Both very busy, sir.”
“Oh! I was afraid, from what you said at first, that something had occurred to stop them in their useful course,” said Scrooge. “I’m very glad to hear it.”
In 1834, the Poor Law Amendment Act grouped local church parishes into unions and charged them with the responsibility of caring for the poor through workhouses. The Act was highly controversial and arguably led to underemployment and starvation.
Charles Dickens was especially not a fan, and he dedicated a whole novel to critiquing them (Oliver Twist), and he had Scrooge praise them in A Christmas Carol.
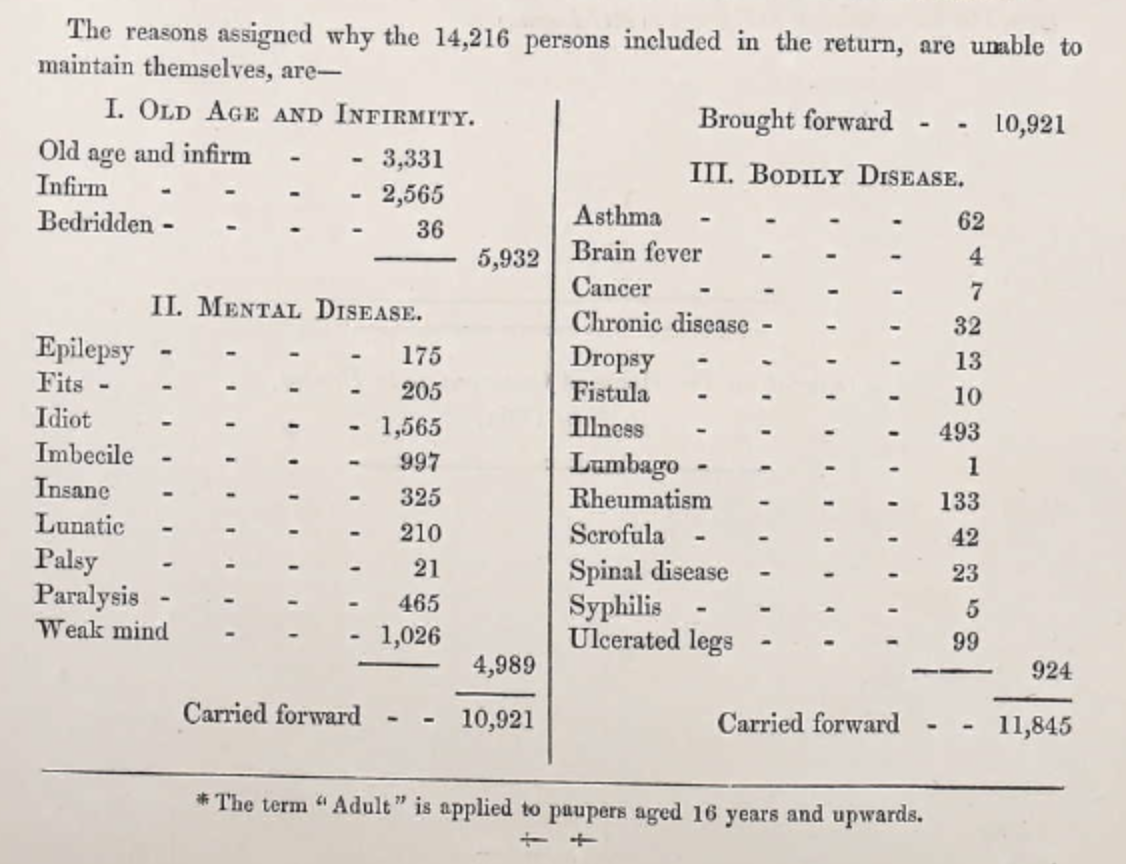
Ancestry.com has an incredible 115-page book that lists all 14,216 people that had been been inmates for at least 5 years in all workhouses in England and Wales as of 1861. Eighteen years after Scrooge’s 1843 Christmas conversion, workhouses were still incredibly well-used and housed all those who were “unable to maintain themselves.”
Important note: If you’re using macOS, you need to download and install XQuartz first.
Today, we’re going to use R/Excel, Illustrator, and InDesign to quickly make a fake policy brief using the text from Dickens’ A Christmas Carol and 1861 workhouse inmate data.
Download the following files:
- A Christmas Carol, Stave IText from Project Gutenberg
- Workhouse inmates, 1861Data from Ancestry.com, England and Wales, Long-Term Workhouse Inmates, 1861, Lehi, UT, USA: Ancestry.com Operations, Inc., 2017. Original data: Long-Term Workhouse Inmates, 1861, Peter Higginbotham, workhouses.org.uk.
Nowadays, we have better terms for the types of mental illness noted by the 19th century workhouse statisticians:
- Idiocy, imbecility: intellecutal disabilities, such as fragile X syndrome, Prader-Willi syndrome, William syndrome, Rett syndrome, autism, etc.
- Insanity, lunacy, weak mindedness: mental illnesses, such as dementia, schizophrenia, melancholia, anxiety, depression, manic-depressive illness, bipolar disorder, etc.
library(tidyverse)
library(forcats)
library(readxl)

inmates <- read_excel("data/workhouse_inmates.xlsx", sheet = "Inmates")
general_type <- inmates %>%
group_by(Category) %>%
summarize(total = sum(Count)) %>%
ungroup() %>%
arrange(total) %>%
mutate(Category = fct_inorder(Category))
plot_types <- ggplot(general_type, aes(x = Category, y = total)) +
geom_pointrange(aes(ymin = 0, ymax = total),
size = 1, fatten = 5) +
scale_y_continuous(labels = scales::comma) +
labs(x = NULL, y = NULL) +
coord_flip() +
theme_minimal() +
theme(panel.grid.major.y = element_blank(),
panel.background = element_rect(fill = "transparent", colour = NA),
plot.background = element_rect(fill = "transparent", colour = NA))
plot_types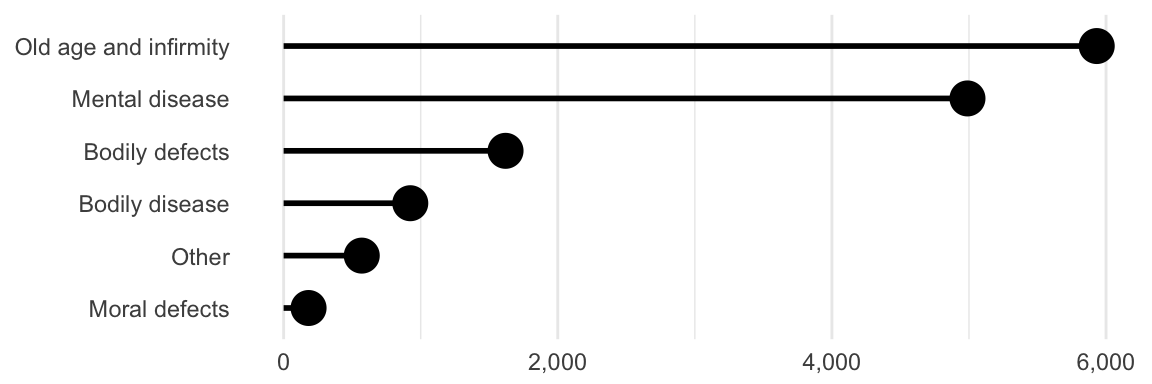
ggsave(plot_types, filename = "output/types.pdf",
       width = 6, height = 2, units = "in", bg = "transparent", device = cairo_pdf)
mental_diseases <- inmates %>%
filter(Category == "Mental disease") %>%
group_by(Cause) %>%
summarize(total = sum(Count)) %>%
ungroup() %>%
arrange(total) %>%
mutate(Cause = fct_inorder(Cause))
plot_mental_diseases <- ggplot(mental_diseases, aes(x = Cause, y = total)) +
geom_pointrange(aes(ymin = 0, ymax = total),
size = 1, fatten = 5) +
scale_y_continuous(labels = scales::comma) +
labs(x = NULL, y = NULL) +
coord_flip() +
theme_minimal() +
theme(panel.grid.major.y = element_blank(),
panel.background = element_rect(fill = "transparent", colour = NA),
plot.background = element_rect(fill = "transparent", colour = NA))
plot_mental_diseases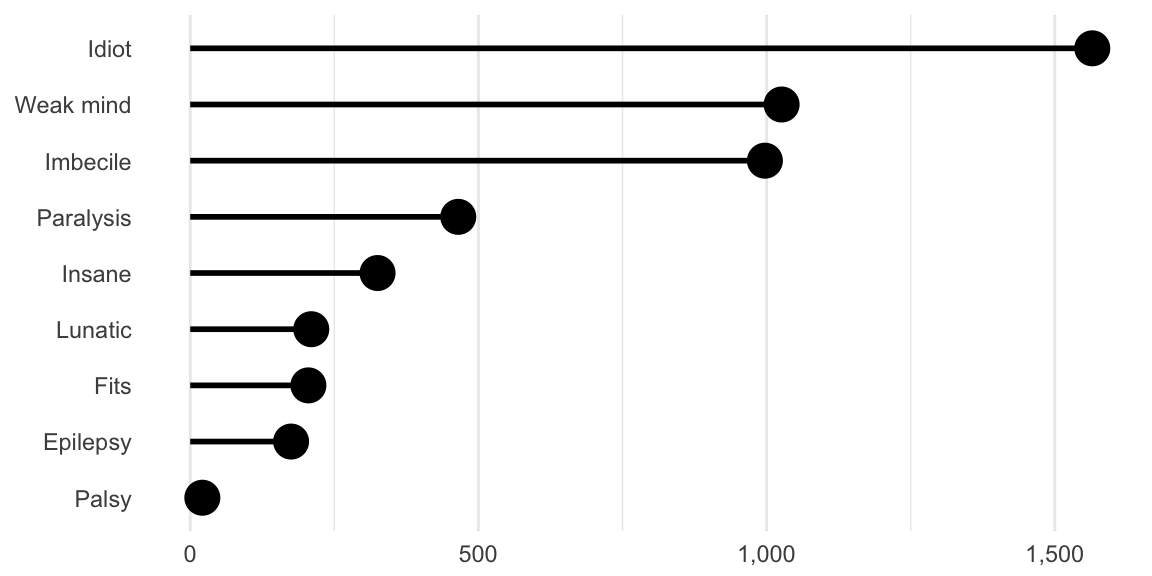
ggsave(plot_mental_diseases, filename = "output/mental-diseases.pdf",
       width = 6, height = 3, units = "in", bg = "transparent", device = cairo_pdf)
Feedback for today
Go to this form and answer these three questions (anonymously if you want):
- What new thing did you learn today?
- What was the most unclear thing about today’s class?
- What was the most exciting thing you learned today?