Clutter and focus
Materials for class on Monday, November 6, 2017
Contents
Slides
Download the slides from today’s lecture.
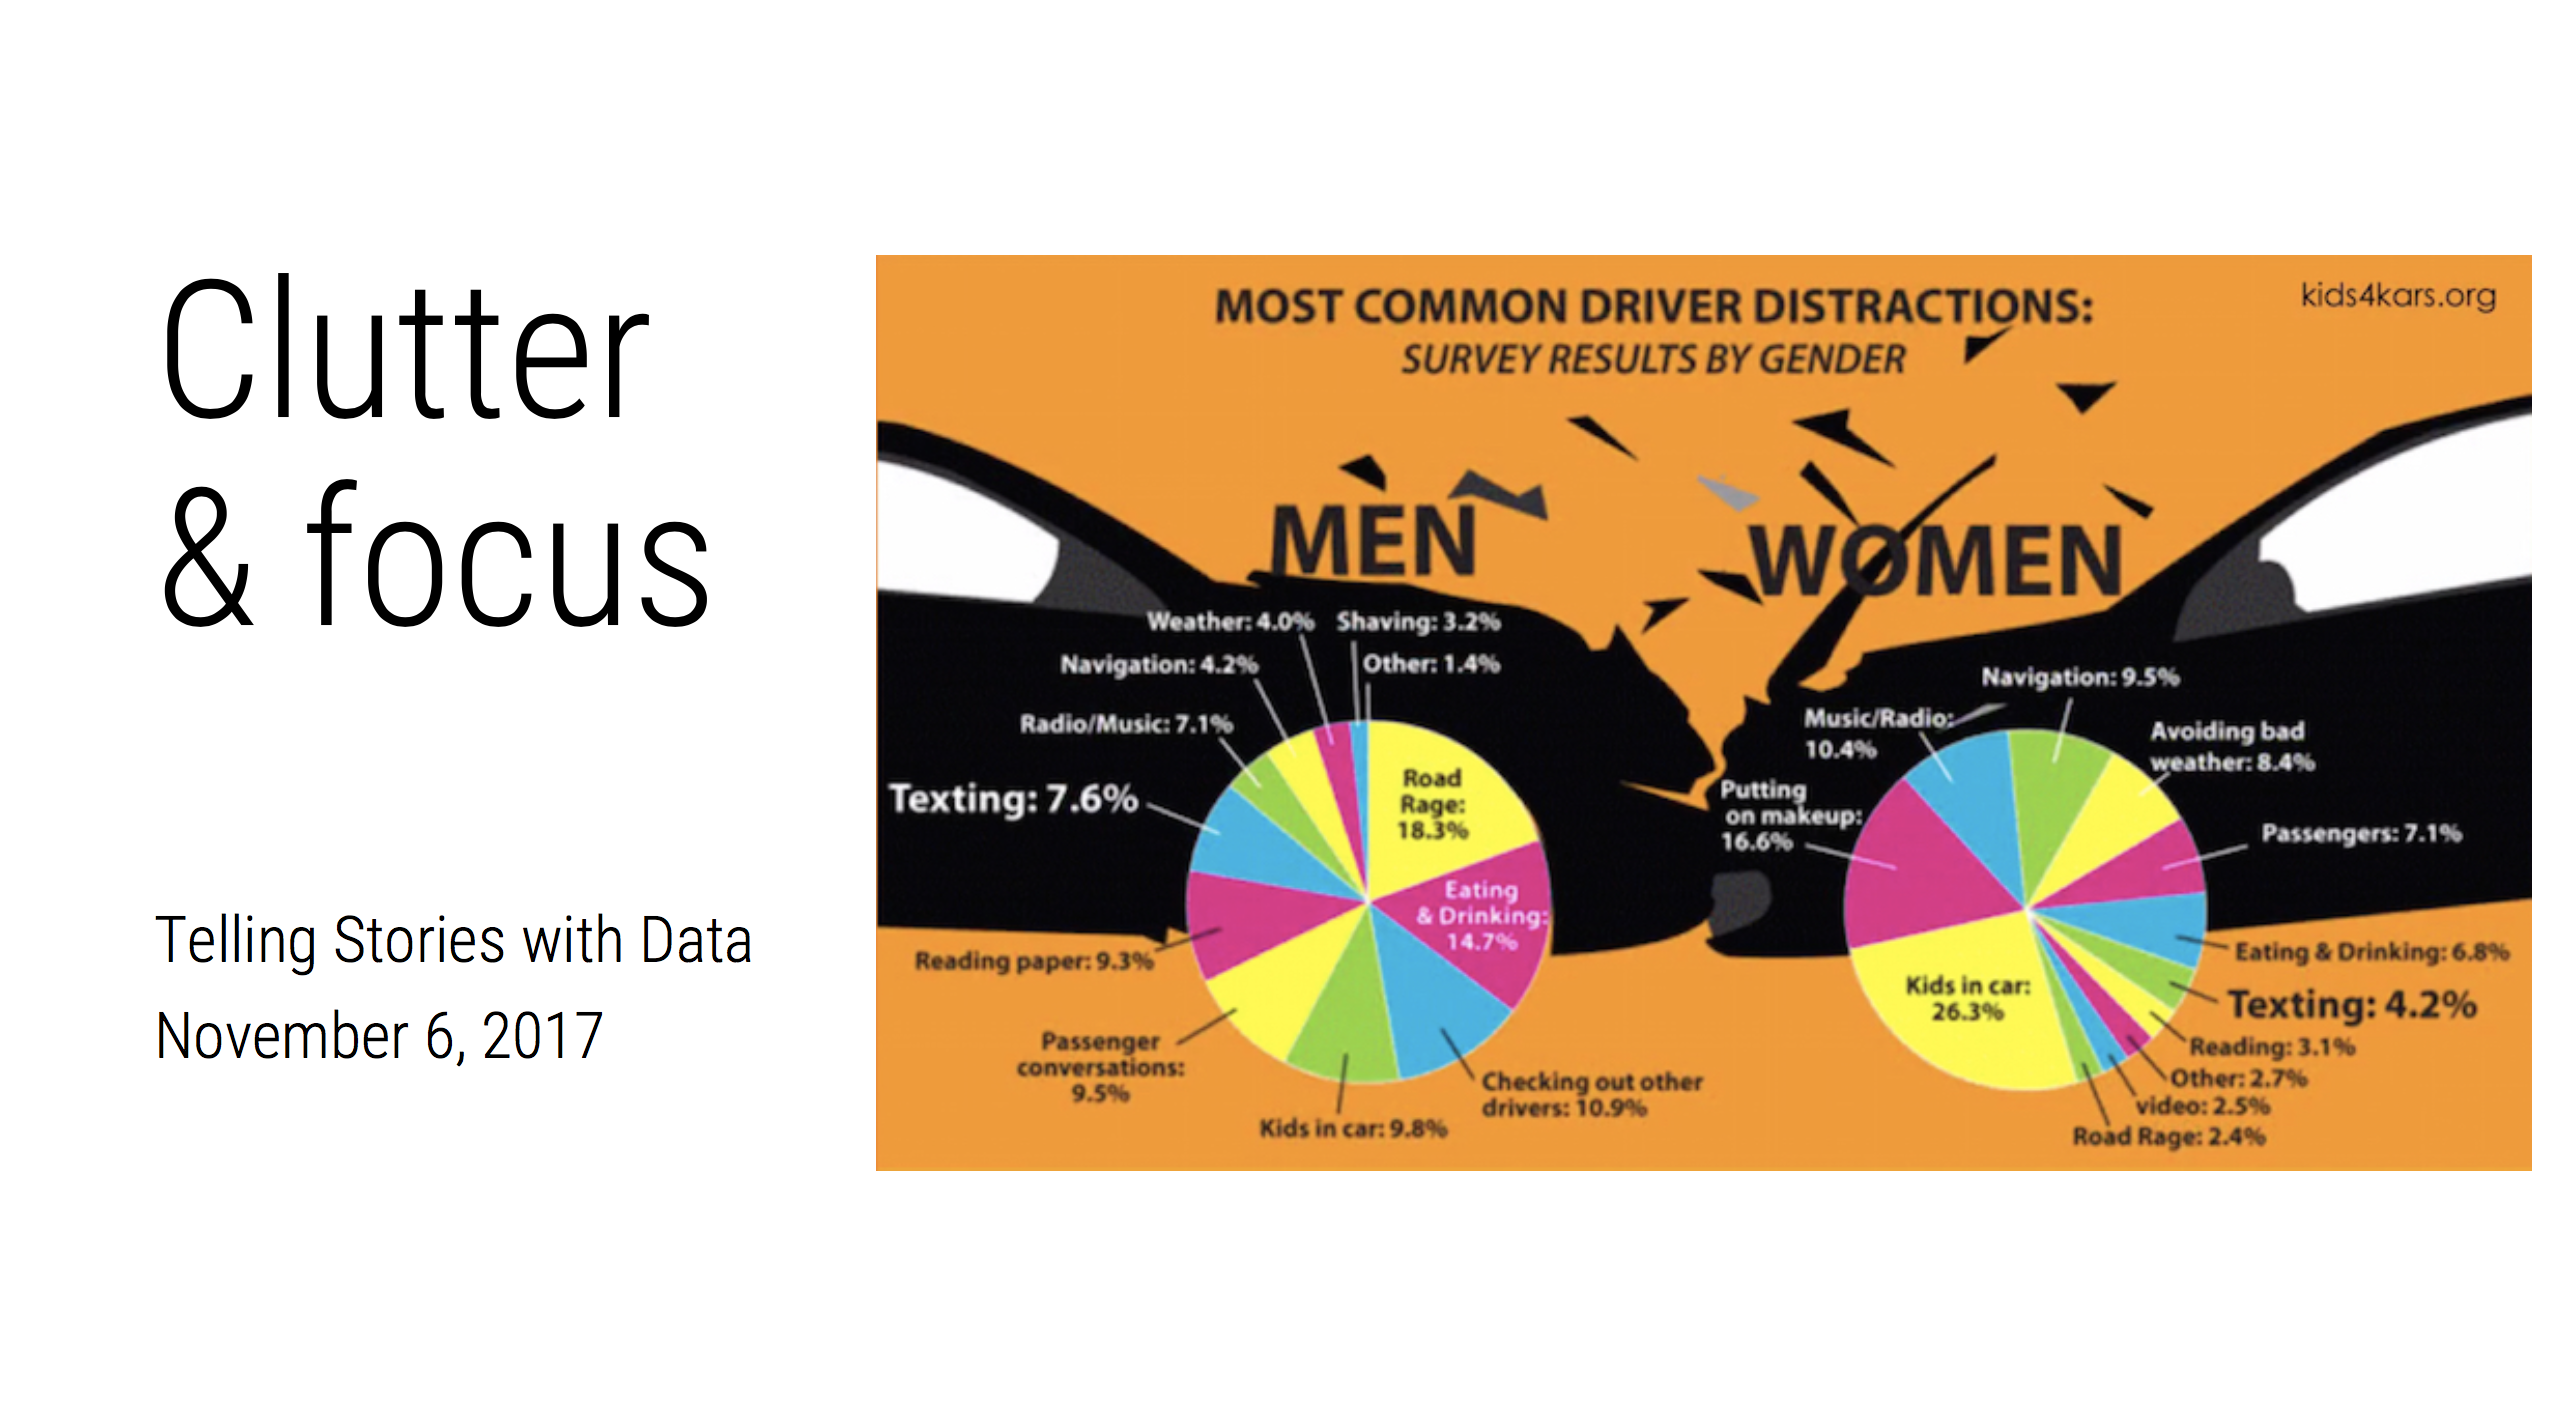
Fonts, colors, and accessibility
See the relevant sections in the Reference page.
Refining and enhancing plots in Illustrator
Data: Nathan’s Famous Hot Dog contest winners Data originally from FlowingData.
Plot with transparent background:
library(tidyverse)

hotdogs <- read_csv("data/hot-dog-contest-winners.csv") %>%
  rename(dogs = `Dogs eaten`, record = `New record`) %>%
  mutate(record = factor(record))

plot_hotdogs <- ggplot(hotdogs, aes(x = Year, y = dogs, fill = record)) +
  geom_col() +
  scale_fill_manual(values = c("grey80", "#FC7300")) +
  scale_x_continuous(breaks = seq(1980, 2010, 2), expand = c(0, 0)) +
  scale_y_continuous(breaks = seq(0, 70, 10), expand = c(0, 0)) +
  guides(fill = FALSE) +
  labs(y = "Hot dogs and buns", x = NULL) +
  theme_minimal() +
  theme(panel.background = element_rect(fill = "transparent", colour = NA),
        plot.background = element_rect(fill = "transparent", colour = NA),
        axis.ticks.x = element_line(size = 0.25),
        panel.grid.major.x = element_blank(),
        panel.grid.major.y = element_line(size = 0.5, linetype = "dashed"),
        panel.grid.minor = element_blank())

plot_hotdogs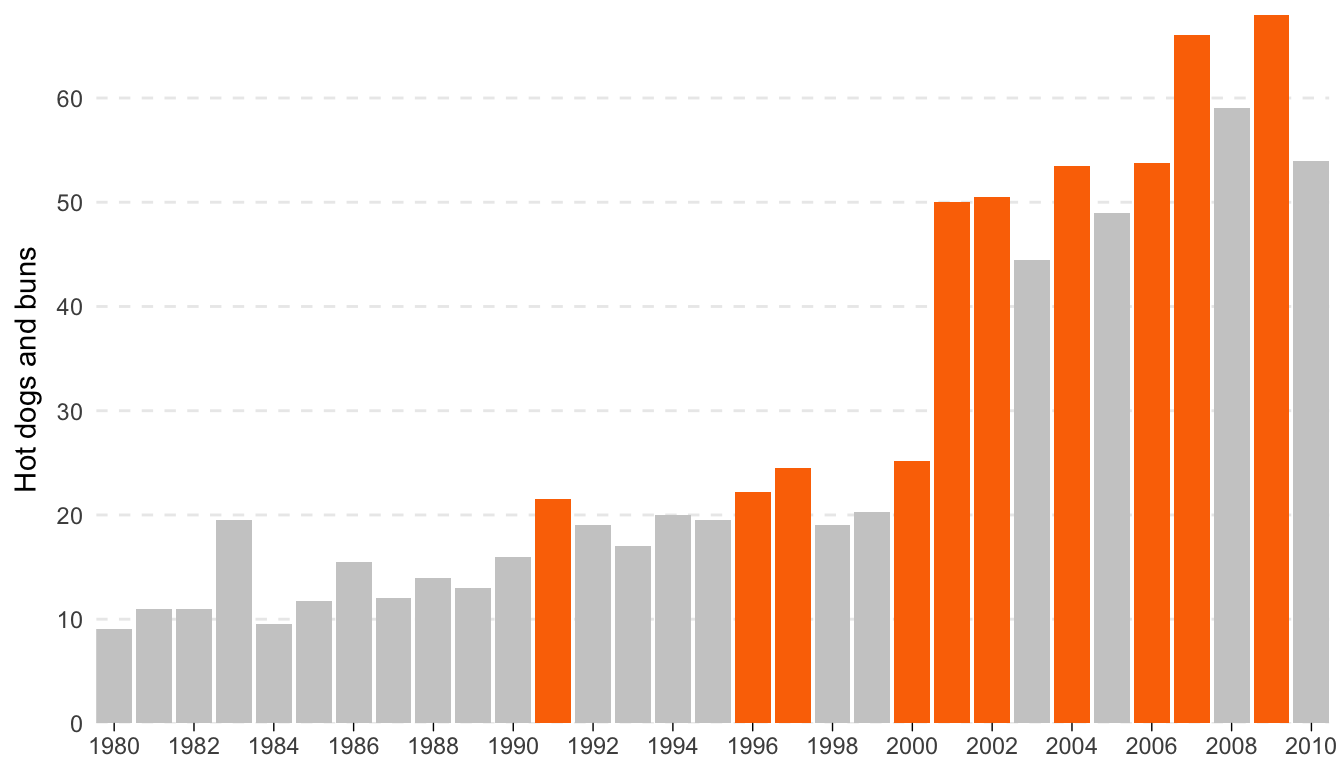
ggsave(plot_hotdogs, filename = "output/hotdogs.pdf",
       width = 7, height = 4, units = "in", bg = "transparent")
Text for annotations:
- Winners from Nathan’s Hot Dog Eating Contest
- It’s that time of year again. Since 1916, the annual eating competition has grown substantially attracting competitors from around the world
- Frank Dellarosa eats 21 and a half HDBs over 12 minutes, breaking the previous record of 19 and a half
- Through 2001-2005, Takeru Kobayashi wins by no less than 12 HDBs. In 2006 he only wins by 1.75. After winning 6 years in a row and setting the world record 4 times, Kobayashi places second in 2007.
- For the first time since 1999, an American reclaims the title when Joey Chestnut consumes 66 HDBs, a new world record. Chestnut repeats in 2008.
- Source: Wikipedia and Nathan’s Famous
Enhanced plot:
Feedback for today
Go to this form and answer these three questions (anonymously if you want):
- What new thing did you learn today?
- What was the most unclear thing about today’s class?
- What was the most exciting thing you learned today?